Water temperature in Villarrica
This data the coastal Villarrica water temperature today, tomorrow and the upcoming days. Besides, you can also get information about the weather and surf forecast, as well as the data on sunrise / sunset and moonrise / moonset at a given point on any given day.
Current water temperature in Villarrica
Water temperature in Villarrica today is 17°C. Based on our historical data over a period of ten years, the warmest water in this day in Villarrica was 18°C, and the coldest was recorded in 2021 at 14°C. Water temperature in Villarrica is expected to drop to 16.2°C in the next 10 days. February average water temperature in Villarrica is 17.4°C, the minimum temperature is 14°C, and the maximum is 22°C.
Throughout the year, the water temperature in Villarrica does not rise above 20°C and therefore is not suitable for comfortable swimming. But on some days of January, February, the water temperature warms up to 20°C and above. The average water temperature in Villarrica in winter reaches 6.8°C, in spring 10.1°C, in summer the average temperature rises to 16.3°C, and in autumn it is 12.1°C.
Villarrica water temperature now
| 22 February 2026 |
|---|
| today temp |
| 17°C |
| 21 February 2026 |
|---|
| yesterday temp |
| 17°C |
Current temperature and weather
Data in a table show Villarrica temperature today (23 February 2026). For more information and forecast for a few days, go to the weather forecast Villarrica.
| 0-3 h | 3-6 h | 6-9 h | 9-12 h |
|---|---|---|---|
| 12.4°C | 10.4°C | 8.9°C | 14.2°C |
| 12-15 h | 15-18 h | 18-21 h | 21-24 h |
|---|---|---|---|
| 23.4°C | 27.5°C | 27.4°C | 16.2°C |
You may also be interested in other sections of our site for Villarrica: Sunrise and Sunset
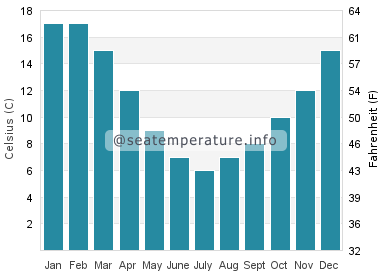
Villarrica water temperature by month
These figures shows the average, minimum and maximum monthly water temperature in Villarrica. In addition to the table values, the graph below displays of changes average surface temperature during the year. Values are calculated based on the data over the past 10 years. Using them, you can check the water temperature in Villarrica on any day of this period that interests you. Click on the month link and you will see a table for each day, or alternatively you can view the temperature curve of the month and select 2 different years you want to compare, either in a table or as a curve
| Month | Avr | Min | Max | |
|---|---|---|---|---|
| January | 16.6°C | 13°C | 21°C | cold |
| Water temperature in Villarrica in January | ||||
| February | 17.4°C | 14°C | 22°C | cold |
| Water temperature in Villarrica in February | ||||
| March | 14.8°C | 3°C | 19°C | cold |
| Water temperature in Villarrica in March | ||||
| April | 12.1°C | 7°C | 15°C | cold |
| Water temperature in Villarrica in April | ||||
| May | 9.4°C | 4°C | 13°C | cold |
| Water temperature in Villarrica in May | ||||
| June | 7.2°C | 4°C | 10°C | cold |
| Water temperature in Villarrica in June | ||||
| July | 6.4°C | 3°C | 10°C | cold |
| Water temperature in Villarrica in July | ||||
| August | 6.9°C | 5°C | 10°C | cold |
| Water temperature in Villarrica in August | ||||
| September | 8°C | 5°C | 11°C | cold |
| Water temperature in Villarrica in September | ||||
| October | 9.9°C | 7°C | 13°C | cold |
| Water temperature in Villarrica in October | ||||
| November | 12.3°C | 7°C | 17°C | cold |
| Water temperature in Villarrica in November | ||||
| December | 15°C | 11°C | 19°C | cold |
| Water temperature in Villarrica in December | ||||
Chart monthly average water temperature in Villarrica