Water temperature in San Pietro a Mare in October
Is it warm enough to swim in San Pietro a Mare in October? Average water temperature in San Pietro a Mare in October is 21.4°C and therefore suitable for comfortable swimming. The warmest sea in San Pietro a Mare in October is 23.8°C, and the coldest is 18°C. To find out the sea temperature today and in the coming days, go to Current sea temperature in San Pietro a Mare
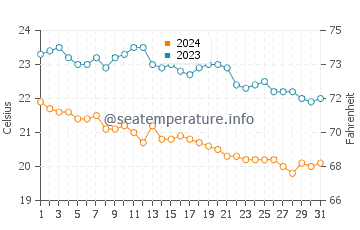
Changes water temperature in San Pietro a Mare in October 2025, 2024
To get an accurate forecast for the water temperature in San Pietro a Mare for any chosen month, compare two years within a 10 year range using the chart below. In addition to the sea water temperature in San Pietro a Mare, the selected years in the table also show the values of the maximum and minimum temperatures on each of the days of October.
You can choose any other years:
| Day |
2025 |
2024 |
Min |
Max |
| 1 October | 23.6°C | 21.9°C | 20.7°C | 23.6°C |
| 2 October | 23.5°C | 21.7°C | 20.9°C | 23.5°C |
| 3 October | 23.5°C | 21.6°C | 21.1°C | 23.8°C |
| 4 October | 23.4°C | 21.6°C | 20.5°C | 23.6°C |
| 5 October | 23.4°C | 21.4°C | 20.4°C | 23.5°C |
| 6 October | 23°C | 21.4°C | 20.7°C | 23.3°C |
| 7 October | 22.9°C | 21.5°C | 20.8°C | 23.4°C |
| 8 October | 22.5°C | 21.1°C | 20.8°C | 23.1°C |
| 9 October | 22.3°C | 21.1°C | 20.8°C | 23.2°C |
| 10 October | 22.1°C | 21.2°C | 20.7°C | 23.3°C |
| 11 October | 22.1°C | 21°C | 20.6°C | 23.5°C |
| 12 October | 22.1°C | 20.7°C | 20.7°C | 23.5°C |
| 13 October | 22.2°C | 21.2°C | 20.7°C | 23°C |
| 14 October | 22.2°C | 20.8°C | 20.5°C | 22.9°C |
| 15 October | 22.2°C | 20.8°C | 20.4°C | 23.1°C |
| Day |
2025 |
2024 |
Min |
Max |
| 16 October | 22.2°C | 20.9°C | 20.1°C | 23.1°C |
| 17 October | 22.1°C | 20.8°C | 20.1°C | 23°C |
| 18 October | 22.1°C | 20.7°C | 19.9°C | 23.3°C |
| 19 October | 22°C | 20.6°C | 19.6°C | 23.1°C |
| 20 October | 22°C | 20.5°C | 19.2°C | 23°C |
| 21 October | 21.9°C | 20.3°C | 19°C | 22.9°C |
| 22 October | 22°C | 20.3°C | 19.2°C | 22.4°C |
| 23 October | 21.8°C | 20.2°C | 19.1°C | 22.3°C |
| 24 October | 21.8°C | 20.2°C | 19.2°C | 22.4°C |
| 25 October | 21.6°C | 20.2°C | 18.9°C | 22.5°C |
| 26 October | 21.5°C | 20.2°C | 18.2°C | 22.2°C |
| 27 October | 21.2°C | 20°C | 18.2°C | 22.2°C |
| 28 October | 21.1°C | 19.8°C | 18.3°C | 22.2°C |
| 29 October | 20.8°C | 20.1°C | 18.1°C | 22°C |
| 30 October | 20.7°C | 20°C | 18.1°C | 21.9°C |
| 31 October | 20.8°C | 20.1°C | 18°C | 22°C |
Average water temperature in San Pietro a Mare in October over a decade
| 2016 | 2017 | 2018 | 2019 | 2020 |
| 21.4°C | 21.3°C | 21.4°C | 21.8°C | 20.6°C |
| 2021 | 2022 | 2023 | 2024 | 2025 |
| 21.4°C | 21.9°C | 22.8°C | 20.8°C | 22.1°C |
San Pietro a Mare water temperature during other months:
You can also view information about water temperature for other months by clicking on the month button below