Water temperature in Escambron Beach in October
Is it warm enough to swim in Escambron Beach in October? Average water temperature in Escambron Beach in October is 29.3°C and therefore suitable for comfortable swimming. The warmest sea in Escambron Beach in October is 30.7°C, and the coldest is 28.2°C. To find out the sea temperature today and in the coming days, go to Current sea temperature in Escambron Beach
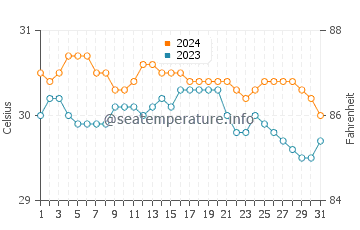
Changes water temperature in Escambron Beach in October 2025, 2024
To get an accurate forecast for the water temperature in Escambron Beach for any chosen month, compare two years within a 10 year range using the chart below. In addition to the sea water temperature in Escambron Beach, the selected years in the table also show the values of the maximum and minimum temperatures on each of the days of October.
You can choose any other years:
| Day |
2025 |
2024 |
Min |
Max |
| 1 October | 29.7°C | 30.5°C | 28.2°C | 30.5°C |
| 2 October | 29.7°C | 30.4°C | 28.2°C | 30.4°C |
| 3 October | 29.8°C | 30.5°C | 28.2°C | 30.5°C |
| 4 October | 29.8°C | 30.7°C | 28.3°C | 30.7°C |
| 5 October | 29.8°C | 30.7°C | 28.4°C | 30.7°C |
| 6 October | 29.8°C | 30.7°C | 28.4°C | 30.7°C |
| 7 October | 29.9°C | 30.5°C | 28.5°C | 30.5°C |
| 8 October | 29.7°C | 30.5°C | 28.5°C | 30.5°C |
| 9 October | 29.8°C | 30.3°C | 28.6°C | 30.3°C |
| 10 October | 29.9°C | 30.3°C | 28.6°C | 30.3°C |
| 11 October | 29.8°C | 30.4°C | 28.6°C | 30.4°C |
| 12 October | 29.8°C | 30.6°C | 28.8°C | 30.6°C |
| 13 October | 29.9°C | 30.6°C | 28.8°C | 30.6°C |
| 14 October | 29.9°C | 30.5°C | 28.7°C | 30.5°C |
| 15 October | 29.8°C | 30.5°C | 28.7°C | 30.5°C |
| Day |
2025 |
2024 |
Min |
Max |
| 16 October | 29.8°C | 30.5°C | 28.6°C | 30.5°C |
| 17 October | 29.5°C | 30.4°C | 28.5°C | 30.4°C |
| 18 October | 29.7°C | 30.4°C | 28.5°C | 30.4°C |
| 19 October | 29.7°C | 30.4°C | 28.5°C | 30.4°C |
| 20 October | 29.7°C | 30.4°C | 28.5°C | 30.4°C |
| 21 October | 29.6°C | 30.4°C | 28.3°C | 30.4°C |
| 22 October | 29.4°C | 30.3°C | 28.3°C | 30.3°C |
| 23 October | 29.4°C | 30.2°C | 28.3°C | 30.2°C |
| 24 October | 29.3°C | 30.3°C | 28.3°C | 30.3°C |
| 25 October | 29.4°C | 30.4°C | 28.5°C | 30.4°C |
| 26 October | 29.3°C | 30.4°C | 28.4°C | 30.4°C |
| 27 October | 29.4°C | 30.4°C | 28.3°C | 30.4°C |
| 28 October | 29.4°C | 30.4°C | 28.4°C | 30.4°C |
| 29 October | 29.3°C | 30.3°C | 28.5°C | 30.3°C |
| 30 October | 29.3°C | 30.2°C | 28.5°C | 30.2°C |
| 31 October | 29.3°C | 30°C | 28.6°C | 30°C |
Average water temperature in Escambron Beach in October over a decade
| 2016 | 2017 | 2018 | 2019 | 2020 |
| 29.1°C | 28.5°C | 28.8°C | 29.8°C | 29.4°C |
| 2021 | 2022 | 2023 | 2024 | 2025 |
| 29.5°C | 29°C | 30°C | 30.4°C | 29.6°C |
Escambron Beach water temperature during other months:
You can also view information about water temperature for other months by clicking on the month button below


