Water temperature in Ain El Turk in November
Is it warm enough to swim in Ain El Turk in November? Average water temperature in Ain El Turk in November is 19°C and therefore is not suitable for comfortable swimming. The warmest sea in Ain El Turk in November is 21.7°C, and the coldest is 16.8°C. Average high air temperature in Ain El Turk in November is 19°C, and average low temperature is 13°C. To find out the sea temperature today and in the coming days, go to Current sea temperature in Ain El Turk
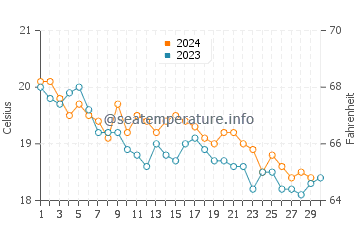
Changes water temperature in Ain El Turk in November 2025, 2024
To get an accurate forecast for the water temperature in Ain El Turk for any chosen month, compare two years within a 10 year range using the chart below. In addition to the sea water temperature in Ain El Turk, the selected years in the table also show the values of the maximum and minimum temperatures on each of the days of November.
You can choose any other years:
| Day | 2025 | 2024 | Min | Max |
|---|---|---|---|---|
| 1 November | 21.3°C | 20.1°C | 19.1°C | 21.4°C |
| 2 November | 21.4°C | 20.1°C | 19.1°C | 21.7°C |
| 3 November | 21.5°C | 19.8°C | 19.1°C | 21.7°C |
| 4 November | 21.2°C | 19.5°C | 18.9°C | 21.5°C |
| 5 November | 21°C | 19.7°C | 18.8°C | 21.5°C |
| 6 November | 20.5°C | 19.5°C | 18.8°C | 21.4°C |
| 7 November | 20.4°C | 19.4°C | 18.6°C | 21.5°C |
| 8 November | 20.4°C | 19.1°C | 18.5°C | 21.3°C |
| 9 November | 20.3°C | 19.7°C | 18.4°C | 21°C |
| 10 November | 20.2°C | 19.2°C | 18.2°C | 20.9°C |
| 11 November | 20.4°C | 19.5°C | 18°C | 20.6°C |
| 12 November | 20.2°C | 19.4°C | 18.1°C | 20.4°C |
| 13 November | 20°C | 19.2°C | 18°C | 20.4°C |
| 14 November | 20.3°C | 19.4°C | 17.8°C | 20.3°C |
| 15 November | 20.1°C | 19.5°C | 17.9°C | 20.6°C |
| Day | 2025 | 2024 | Min | Max |
|---|---|---|---|---|
| 16 November | 19.9°C | 19.4°C | 17.7°C | 20.5°C |
| 17 November | 20.1°C | 19.3°C | 17.7°C | 20.4°C |
| 18 November | 19.7°C | 19.1°C | 17.5°C | 20.2°C |
| 19 November | 19.6°C | 19°C | 17.5°C | 20.2°C |
| 20 November | 19.6°C | 19.2°C | 17.6°C | 20.1°C |
| 21 November | 19.4°C | 19.2°C | 17.4°C | 19.8°C |
| 22 November | 19.3°C | 19°C | 17.3°C | 19.9°C |
| 23 November | 18.8°C | 18.9°C | 17.3°C | 19.9°C |
| 24 November | 18.6°C | 18.5°C | 17.3°C | 19.5°C |
| 25 November | 18.5°C | 18.8°C | 17.2°C | 19.4°C |
| 26 November | 18.4°C | 18.6°C | 17.1°C | 19.3°C |
| 27 November | 17.8°C | 18.4°C | 16.9°C | 18.9°C |
| 28 November | 18°C | 18.5°C | 16.8°C | 18.7°C |
| 29 November | 17.7°C | 18.4°C | 16.8°C | 18.4°C |
| 30 November | 17.6°C | 18.8°C | 16.9°C | 18.8°C |
Want to know the water temperature and sea conditions in a location you're interested in without having to search for it every time? Install our app for Android or iOS and stay up-to-date.
Average water temperature in Ain El Turk in November over a decade
| 2016 | 2017 | 2018 | 2019 | 2020 |
| 18.9°C | 19.5°C | 18.5°C | 18.8°C | 19.1°C |
| 2021 | 2022 | 2023 | 2024 | 2025 |
| 18.9°C | 20.3°C | 18.9°C | 19.2°C | 19.7°C |
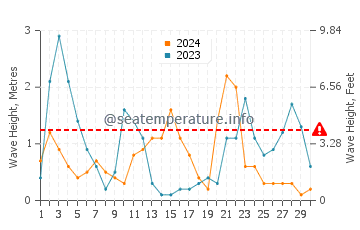
Ain El Turk sea state in November
Chart comparing the height of waves in Ain El Turk in November over the past years. The red line indicates the height of the waves when swimming in the sea is prohibited. To view the current sea conditions, click on the graph.
Weather and climate in Ain El Turk in November
This data display average monthly climate indicators in Ain El Turk in November based on our historical weather readings over a period of ten years. In addition to temperature, we include data on the number of rainy and sunny days so you can have all the information about your destination before your trip
- Average HIGH temperature19°C
- Average LOW temperature13°C
- Average rainfall1.8''/46mm
Ain El Turk water temperature during other months:
You can also view information about water temperature for other months by clicking on the month button below
