Temperature dell'acqua a Port Albert (VIC) ad ottobre
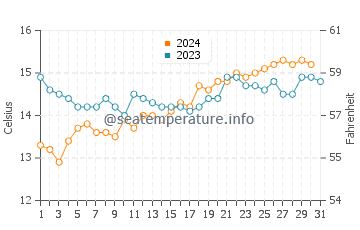
Fa abbastanza caldo per nuotare a Port Albert ad ottobre? La temperatura dell'acqua più alta a Port Albert ad ottobre è di 16.1°C, la temperatura più bassa è di 12.2°C. La temperatura media dell'acqua a Port Albert a gennaio è di 14.1°C e quindi non è adatta per un nuoto confortevole. Per conoscere la temperatura attuale acqua e nei prossimi giorni, vai su Temperatura mare a Port Albert oggi
Cambia la temperatura dell'acqua a Port Albert ad ottobre 2025, 2024
Per ottenere le previsioni precise della temperatura dell'acqua a Port Albert per qualsiasi mese, confronta i dati meteo di due anni (entro un intervallo di dieci anni) usando la tabella seguente. Oltre alla temperatura dell'acqua di mare a Port Albert, gli anni selezionati nella tabella mostrano anche i valori delle temperature massime e minime in ciascuno dei giorni ad ottobre.
Puoi scegliere altri anni:
| Giorno | 2025 | 2024 | Min | Mas |
|---|---|---|---|---|
| 1 ottobre | 13.3°C | 13.3°C | 12.2°C | 14.9°C |
| 2 ottobre | 13.3°C | 13.2°C | 12.5°C | 14.6°C |
| 3 ottobre | 13.2°C | 12.9°C | 12.8°C | 14.5°C |
| 4 ottobre | 13.2°C | 13.4°C | 12.6°C | 14.4°C |
| 5 ottobre | 13.5°C | 13.7°C | 12.8°C | 14.2°C |
| 6 ottobre | 13.7°C | 13.8°C | 12.8°C | 14.2°C |
| 7 ottobre | 13.8°C | 13.6°C | 12.9°C | 14.2°C |
| 8 ottobre | 13.7°C | 13.6°C | 13°C | 14.4°C |
| 9 ottobre | 14°C | 13.5°C | 12.9°C | 14.3°C |
| 10 ottobre | 14°C | 13.9°C | 12.9°C | 14.3°C |
| 11 ottobre | 14.1°C | 13.7°C | 13.2°C | 14.5°C |
| 12 ottobre | 13.9°C | 14°C | 13.1°C | 14.4°C |
| 13 ottobre | 14.1°C | 14°C | 13.2°C | 14.5°C |
| 14 ottobre | 14.2°C | 13.9°C | 12.4°C | 14.8°C |
| 15 ottobre | 14.4°C | 14.1°C | 12.6°C | 14.9°C |
| Giorno | 2025 | 2024 | Min | Mas |
|---|---|---|---|---|
| 16 ottobre | 14.3°C | 14.3°C | 13°C | 14.8°C |
| 17 ottobre | 14.5°C | 14.2°C | 13.2°C | 15.1°C |
| 18 ottobre | 14.6°C | 14.7°C | 13.3°C | 15.5°C |
| 19 ottobre | 14.5°C | 14.6°C | 13.4°C | 14.9°C |
| 20 ottobre | 14.4°C | 14.8°C | 13.5°C | 15.6°C |
| 21 ottobre | 14.9°C | 14.8°C | 13.4°C | 15.4°C |
| 22 ottobre | 14.6°C | 15°C | 13.5°C | 15.6°C |
| 23 ottobre | 15°C | 14.9°C | 13.6°C | 15.4°C |
| 24 ottobre | 14.9°C | 15°C | 13.6°C | 15.5°C |
| 25 ottobre | 14.8°C | 15.1°C | 13.7°C | 15.6°C |
| 26 ottobre | 14.8°C | 15.2°C | 13.7°C | 15.3°C |
| 27 ottobre | 14.9°C | 15.3°C | 13.8°C | 15.4°C |
| 28 ottobre | 14.5°C | 15.2°C | 13.9°C | 15.5°C |
| 29 ottobre | 14.6°C | 15.3°C | 14°C | 15.7°C |
| 30 ottobre | 15°C | 15.2°C | 14°C | 15.8°C |
| 31 ottobre | 14.8°C | 15.2°C | 13.9°C | 16.1°C |
Temperatura media dell'acqua a Port Albert ad ottobre
| 2016 | 2017 | 2018 | 2019 | 2020 |
| 13.6°C | 14.3°C | 14.5°C | 13.9°C | 14°C |
| 2021 | 2022 | 2023 | 2024 | 2025 |
| 14.2°C | 14.4°C | 14.5°C | 14.3°C | 14.2°C |
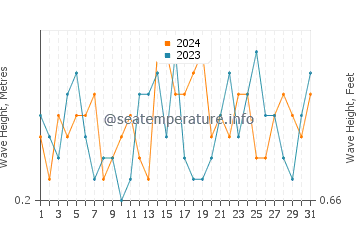
Meteo mare Port Albert ad ottobre
Grafico che confronta l'altezza delle onde a Port Albert ad ottobre negli ultimi anni. La linea rossa indica l'altezza delle onde quando è vietato nuotare in mare. Per visualizzare le attuali condizioni del mare, cliccare sul grafico.
Temperature dell'acqua a Port Albert durante gli altri mesi:
Puoi anche vedere le informazioni sulla temperatura dell'acqua per altri mesi facendo clic sul pulsante del mese in basso
