Temperature dell'acqua ad Arbon ad ottobre
Fa abbastanza caldo per nuotare ad Arbon ad ottobre? La temperatura dell'acqua più alta ad Arbon ad ottobre è di 18.9°C, la temperatura più bassa è di 11.6°C. La temperatura media dell'acqua ad Arbon a gennaio è di 14.7°C e quindi non è adatta per un nuoto confortevole. Per conoscere la temperatura attuale acqua e nei prossimi giorni, vai su Temperatura mare ad Arbon oggi
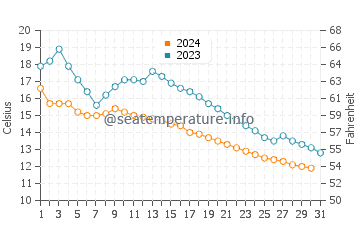
Cambia la temperatura dell'acqua ad Arbon ad ottobre 2025, 2024
Per ottenere le previsioni precise della temperatura dell'acqua ad Arbon per qualsiasi mese, confronta i dati meteo di due anni (entro un intervallo di dieci anni) usando la tabella seguente. Oltre alla temperatura dell'acqua di mare ad Arbon, gli anni selezionati nella tabella mostrano anche i valori delle temperature massime e minime in ciascuno dei giorni ad ottobre.
Puoi scegliere altri anni:
| Giorno |
2025 |
2024 |
Min |
Mas |
| 1 ottobre | 16.5°C | 16.6°C | 16.2°C | 17.9°C |
| 2 ottobre | 16.3°C | 15.7°C | 15.7°C | 18.2°C |
| 3 ottobre | 16.2°C | 15.7°C | 15.7°C | 18.9°C |
| 4 ottobre | 16.3°C | 15.7°C | 15.5°C | 17.9°C |
| 5 ottobre | 16.1°C | 15.2°C | 15.2°C | 17.1°C |
| 6 ottobre | 15.9°C | 15°C | 15°C | 16.6°C |
| 7 ottobre | 15°C | 15°C | 15°C | 16.6°C |
| 8 ottobre | 14.8°C | 15.1°C | 14.8°C | 16.7°C |
| 9 ottobre | 15.1°C | 15.4°C | 14.8°C | 16.7°C |
| 10 ottobre | 14.9°C | 15.2°C | 14.5°C | 17.1°C |
| 11 ottobre | 14.8°C | 15°C | 14.3°C | 17.1°C |
| 12 ottobre | 14.8°C | 14.9°C | 14°C | 17°C |
| 13 ottobre | 14.8°C | 14.8°C | 13.9°C | 17.6°C |
| 14 ottobre | 14.4°C | 14.7°C | 13.7°C | 17.3°C |
| 15 ottobre | 14.2°C | 14.5°C | 13.7°C | 16.9°C |
| Giorno |
2025 |
2024 |
Min |
Mas |
| 16 ottobre | 14.1°C | 14.4°C | 13.6°C | 16.6°C |
| 17 ottobre | 14°C | 14°C | 13.6°C | 16.4°C |
| 18 ottobre | 14.6°C | 13.9°C | 13.5°C | 16.1°C |
| 19 ottobre | 14.3°C | 13.7°C | 13.2°C | 15.7°C |
| 20 ottobre | 14.1°C | 13.5°C | 13°C | 15.8°C |
| 21 ottobre | 13.9°C | 13.3°C | 12.8°C | 15.5°C |
| 22 ottobre | 13.6°C | 13.1°C | 12.6°C | 15.4°C |
| 23 ottobre | 13.5°C | 12.9°C | 12.3°C | 15°C |
| 24 ottobre | 13.3°C | 12.7°C | 12.1°C | 15°C |
| 25 ottobre | 12.9°C | 12.5°C | 11.9°C | 14.9°C |
| 26 ottobre | 12.8°C | 12.4°C | 11.8°C | 14.9°C |
| 27 ottobre | 12.4°C | 12.3°C | 11.7°C | 15.2°C |
| 28 ottobre | 12°C | 12.1°C | 11.6°C | 14.8°C |
| 29 ottobre | 11.9°C | 12°C | 11.6°C | 14.5°C |
| 30 ottobre | 11.7°C | 11.9°C | 11.6°C | 14.5°C |
| 31 ottobre | 11.9°C | 12.8°C | 11.9°C | 15.2°C |
Temperatura media dell'acqua ad Arbon ad ottobre
| 2016 | 2017 | 2018 | 2019 | 2020 |
| 14.4°C | 14.6°C | 15.8°C | 15°C | 14.6°C |
| 2021 | 2022 | 2023 | 2024 | 2025 |
| 14.4°C | 15.1°C | 15.8°C | 14.1°C | 14.2°C |
Temperature dell'acqua ad Arbon durante gli altri mesi:
Puoi anche vedere le informazioni sulla temperatura dell'acqua per altri mesi facendo clic sul pulsante del mese in basso