Gillson Beach water temp
This data the coastal Gillson Beach water temperature today, tomorrow and the upcoming days. Besides, you can also get information about the weather and surf forecast, as well as the data on sunrise / sunset and moonrise / moonset at a given point on any given day.
Current water temperature in Gillson Beach
Water temperature in Gillson Beach today is 34.2°F. Based on our historical data over a period of ten years, the warmest water in this day in Gillson Beach was recorded in 2017 and was 37.2°F, and the coldest was recorded in 2015 at 31.5°F. Water temperature in Gillson Beach is expected to rise to 34.3°F in the next 10 days. February average water temperature in Gillson Beach is 33.8°F, the minimum temperature is 30.6°F, and the maximum is 38.3°F.
The swimming season in Gillson Beach lasts from July to September. During those months, Gillson Beach water temperature does not drop below 68°F and therefore suitable for comfortable swimming. The average water temperature in Gillson Beach in winter reaches 36.7°F, in spring 42.8°F, in summer the average temperature rises to 68.2°F, and in autumn it is 58.5°F.
Gillson Beach water temperature now
| February 22, 2026 |
|---|
| today temp |
| 34.2°F |
| February 21, 2026 |
|---|
| yesterday temp |
| 33.6°F |
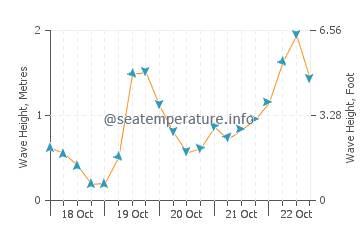
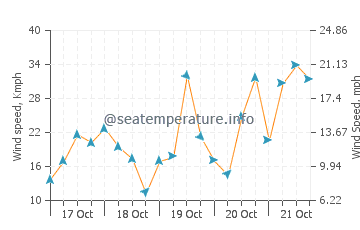
Surf Forecast in Gillson Beach for today
Another important indicators for a comfortable holiday on the beach are the presence and height of the waves, as well as the speed and direction of the wind. Please find below data on the swell size for Gillson Beach. We calculate the swell size based on the mean wave height (trough to crest) of each third highest wave. For more information on surf forecasts for the next ten days, please visit sea state forecast Gillson Beach. Data in table shown for February 23, 2026, time in GMT 0 format (you can change the time zone on the sea state forecast page)
| 0-3 h | 3-6 h | 6-9 h | 9-12 h |
|---|---|---|---|
| 2' 0" | 2' 4" | 2' 10" | 3' 3" |
| 0.61 m | 0.72 m | 0.86 m | 0.98 m |
| 12-15 h | 15-18 h | 18-21 h | 21-24 h |
|---|---|---|---|
| 3' 11" | 4' 5" | 4' 8" | 5' 0" |
| 1.19 m | 1.35 m | 1.41 m | 1.53 m |
Surf report in Gillson Beach
Gillson Beach weather forecast
Current temperature and weather
Data in a table show Gillson Beach temperature today (February 23, 2026). For more information and forecast for a few days, go to the weather forecast Gillson Beach.
| 0-3 h | 3-6 h | 6-9 h | 9-12 h |
|---|---|---|---|
| 27.1°F | 25.5°F | 24.6°F | 24.4°F |
| 12-15 h | 15-18 h | 18-21 h | 21-24 h |
|---|---|---|---|
| 26.2°F | 27.3°F | 25°F | 23.5°F |
You may also be interested in other sections of our site for Gillson Beach: Sunrise and Sunset
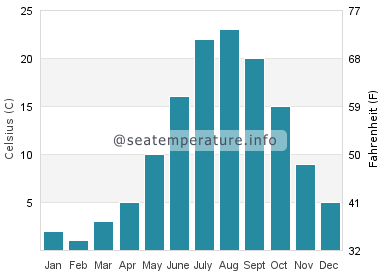
Gillson Beach water temperature by month
These figures shows the average, minimum and maximum monthly water temperature in Gillson Beach. In addition to the table values, the graph below displays of changes average surface temperature during the year. Values are calculated based on the data over the past 10 years. Using them, you can check the water temperature in Gillson Beach on any day of this period that interests you. Click on the month link and you will see a table for each day, or alternatively you can view the temperature curve of the month and select 2 different years you want to compare, either in a table or as a curve
| Month | Avr | Min | Max | |
|---|---|---|---|---|
| January | 35.6°F | 30.4°F | 41.9°F | cold |
| Water temperature in Gillson Beach in January | ||||
| February | 33.8°F | 30.6°F | 38.3°F | cold |
| Water temperature in Gillson Beach in February | ||||
| March | 36.5°F | 31.1°F | 45.1°F | cold |
| Water temperature in Gillson Beach in March | ||||
| April | 41.7°F | 34.7°F | 50°F | cold |
| Water temperature in Gillson Beach in April | ||||
| May | 50.4°F | 42.1°F | 63.7°F | cold |
| Water temperature in Gillson Beach in May | ||||
| June | 61.2°F | 49.8°F | 72.1°F | cold |
| Water temperature in Gillson Beach in June | ||||
| July | 70.7°F | 59.7°F | 77.9°F | warm |
| Water temperature in Gillson Beach in July | ||||
| August | 72.9°F | 66.4°F | 77.5°F | warm |
| Water temperature in Gillson Beach in August | ||||
| September | 68.4°F | 56.8°F | 75°F | warm |
| Water temperature in Gillson Beach in September | ||||
| October | 58.6°F | 46.4°F | 71.4°F | cold |
| Water temperature in Gillson Beach in October | ||||
| November | 48.6°F | 39.6°F | 57.2°F | cold |
| Water temperature in Gillson Beach in November | ||||
| December | 40.5°F | 32.5°F | 46.4°F | cold |
| Water temperature in Gillson Beach in December | ||||
Chart monthly average water temperature in Gillson Beach